In this section we provide some details of the dynamics of the phenomenon: how it evolved over time, the activity of the trolls and the places more frequently mentioned by trolls. We conclude, in line with the previous sections, that trolls are qell aware of what causes divisiveness in the country and act accordingly. Time patterns reflect crucial episodes, and references to places match specific local issues.
We start by taking a closer look at the proportions of the phenomenon of the Italian IRA trolls.
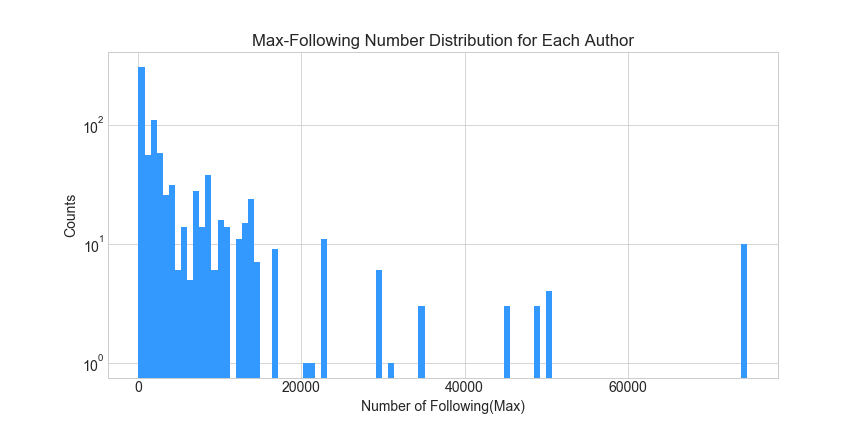
Followers and Following
Although figures on this side have to be taken with caution, since we cannot rule out altogether the possibility of there being bots and scams, the data show that proportions are quite impressive in terms of number of following,
and followers:
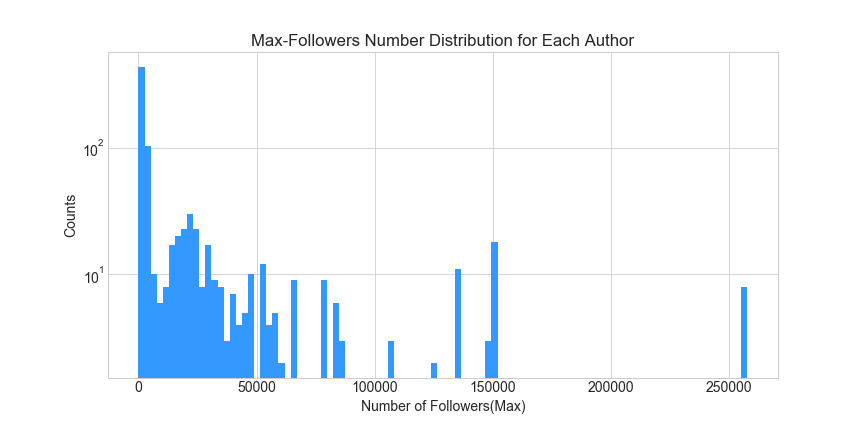
where the scales are logarithmic.
The following histogram, in log scale as well, sums up the daily activity of trolls, in terms of the average number of tweets produced every day:
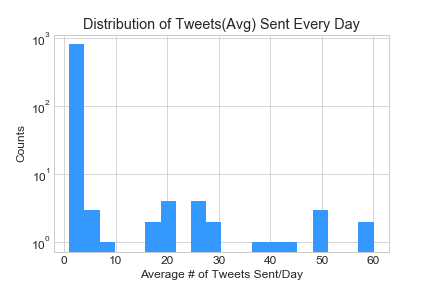
It looks like trolls try to cover all the spectrum of sizes and activity levels: always under the aforementioned caveat, some of them are extremely prolific, some others have a low key profile. We have seen this tendency in virtually all of the topics we considered: the idea is again that trolls try to engage as wide a public as possible to stir up debate.
Time Analysis
Is there a peak of activity of trolls during significant moments of the past years? If trolls intend to influence our perception of politics and society, we would expect them to give relevance to disruptive events, crisis and elections and to be more active on these occasions.
To get a visual intuition of this fact we plot the historical evolution of the number of tweets per day.
The activity of “Italian” trolls dates back to 2011 and is clearly not even across the months which follow.
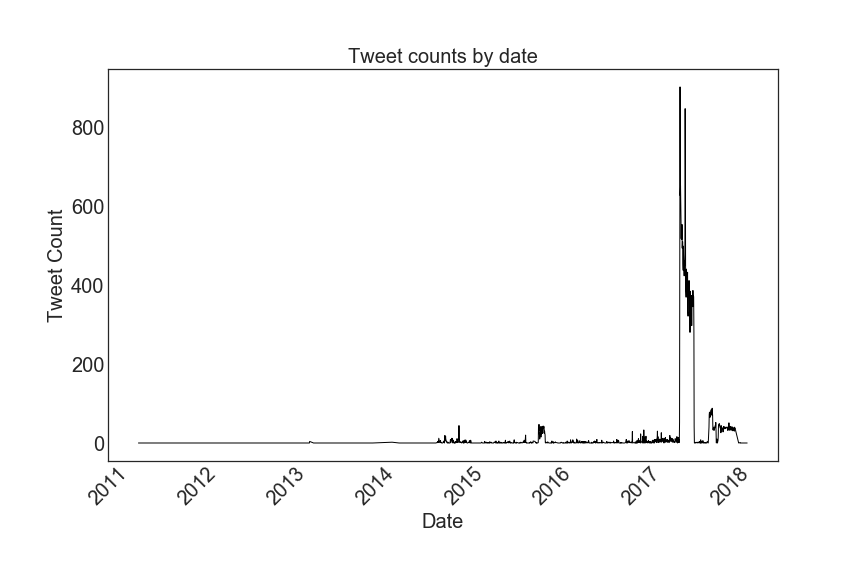
We observe a period of exceptional outpouring of tweets in the first months of 2017. These corresponded to months of political tension across Europe due to the presence of numerous terrorists’ attacks: London, Stockholm, Paris, St Petersburg, Manchester were among the cities which witnessed these attacks. Trolls might use the rise of Islamic terrorism as a sign of the difficulties of Europe and as a way to support the anti-immigration messages of populist parties, as fear stimulates nationalism.
If we now zoom in on the other months, by excluding the 2017 peak, we can find further evidence of the divisive strategy of trolls.
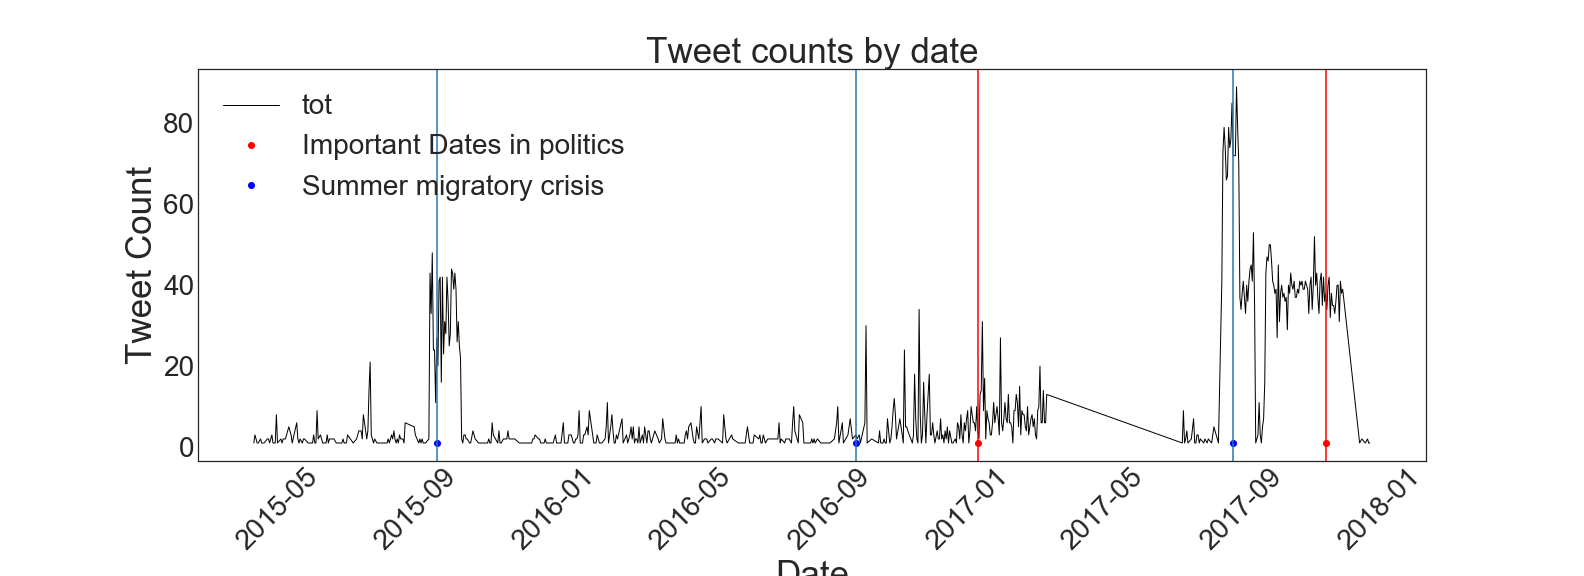
We highlight in the time series:
-
migratory crisis, which usually occur in summer;
-
the Italian constitutional referendum, at the end of 2016, whose outcome was one of the main causes of the fall of the centre-left party;
-
the build-up to the general elections which took place at the beginning of 2018.
Despite not being the exclusive topics, trolls do not miss the opportunity to mention these occurrences, which tend to devide the country in opposing factions. Check the notebook for tweet examples.
Trolls’ favourite places
We want to see if there are places trolls mention more often in their tweets. We thus check references to every Italian municipality and region and count the number of mentions grouping by region. In the following map results are normalized by the size of the regional polpulation.
By clicking on the map some examples of tweets are provided. Lorena Fava talks about terrorism and social problems in Southern Italy, while Vittore Guidi is critical about the Five-Star administration in Rome. Selected tweets for northern Italy refelct issues with migrations: tensions at the border with Austria and migrants handling in Ventimiglia, Liguria.